The numbers behind buying your first home

We dig into the real data on the Australian first home buyer market and publish what we find: independent, sourced, and free to read or cite. Journalists after the figures or a chart can email hello@nestpath.com.au.

6 original studiesIndependent and sourcedFree to cite
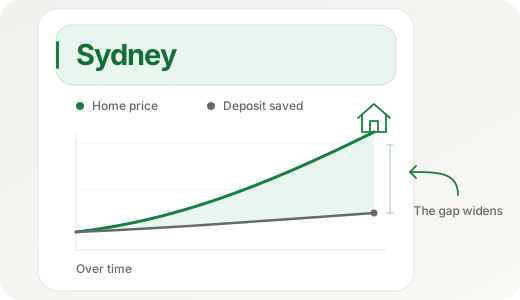
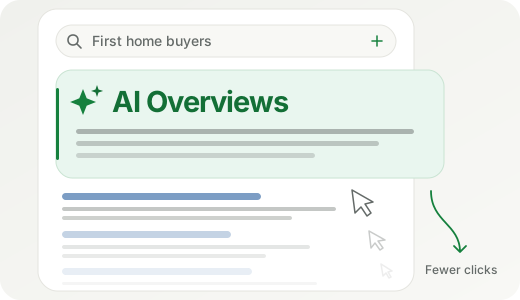
June 2026Cited, Not ClickedAI engines cited our pages 17,673 times in a month and sent back 148 clicks, about 120 citations for every click. Our own data on the AI content economy, set beside Cloudflare, Pew and Similarweb.Read the study June 2026The Income WallIn 7 of the 8 capitals you need to out-earn the typical local household just to buy the median home. The deposit is not the wall. Serviceability is. We worked out the salary each city really demands.Read the study June 2026The 5% Deposit TrapNew Cotality data shows the uncapped 5% scheme is pushing up the homes first home buyers can afford faster than everything else, while the pool of affordable suburbs shrinks. We charted it.Read the study May 2026First home buyer stamp duty, by capital and price tierWhat a first home buyer actually pays in stamp duty across the six mainland capitals, where the concessions wipe it out, and where they do not. Computed from the live state revenue formulas.Read the study May 2026The Deposit TreadmillHow far Sydney first-home suburbs have run ahead of the deposit a typical buyer can save, and what that does to the years it takes to get in.Read the study May 2026How AI Overviews are swallowing first home buyer clicksOriginal Search Console data on the collapse in click-through for Australian first-home-buyer searches as AI Overviews take the top of the page.Read the study

Ready to put the numbers to work?

We match first home buyers with a broker who knows the schemes and the market, for free. The lender pays them, not you.

Get matched with a free broker